


The Indian passenger vehicle (PV) industry closed its strongest first half on record during H1 2026 (January–June 2026), recording total domestic sales of 25,91,566 units across all powertrain types. This represents a 18.4 percent year-on-year (YoY) volume expansion compared to the 21,88,246 units dispatched during H1 2025.
While petrol-powered vehicles retained the largest absolute volume share at 13.42 Lakh units, alternative fuel choices—specifically Compressed Natural Gas (CNG) and Battery Electric Vehicles (BEVs)—grew at significantly faster rates, accounting for the majority of incremental volume expansion in the market.
1. Macro Powertrain Overview: H1 2026 vs. H1 2025
The powertrain landscape in India underwent shifts during the first six months of 2026. CNG emerged as the second-largest fuel category behind petrol, displacing diesel in overall volume, while pure electric vehicles achieved a 65 percent year-on-year surge.
The table below outlines the overall volume distribution, growth rates, and market share changes across all five primary powertrain categories in India during H1 2026:
| Powertrain Fuel Category | H1 2025 Sales (Units) | H1 2026 Sales (Units) | YoY Volume Change | YoY Growth (%) | H1 2026 Market Share (%) |
| Petrol (Pure ICE) | 12,23,451 | 13,42,304 | +1,18,853 | +10.0% | 51.8% |
| CNG (Factory-Fitted) | 4,26,986 | 5,96,236 | +1,69,250 | +39.6% | 23.0% |
| Diesel (Pure ICE) | 3,95,605 | 4,56,076 | +60,471 | +15.3% | 17.6% |
| Battery Electric (BEV) | 84,357 | 1,39,065 | +54,708 | +64.9% | 5.4% |
| Strong Hybrid (HEV) | 57,847 | 57,885 | +38 | +0.1% | 2.2% |
| Total PV Industry | 21,88,246 | 25,91,566 | +4,03,320 | +18.4% | 100.0% |
2. Petrol Powertrain Segment: Volume Leader with Shrinking Share
Petrol vehicles continued to account for over half of all passenger cars sold in India, generating 13,42,304 unit dispatches.However, despite registering a healthy 10 percent volume growth, petrol’s total market share dipped from 55.9 percent in H1 2025 to 51.8 percent in H1 2026, as buyers increasingly shifted toward CNG and electric variants.
Manufacturer Performance & Bestselling Models:
- Maruti Suzuki Dominance: Maruti Suzuki remained the leader in pure petrol sales, dispatching 5,93,466 units and capturing 44.2 percent of the petrol segment.
- Secondary Players: Hyundai ranked second with 1,93,301 petrol units (14.4% share), followed by Tata Motors (1,69,507 units, 12.6% share) and Kia India (1,09,580 units, 8.2% share).
The table below lists the top 5 bestselling petrol-powered passenger car models in India during H1 2026:
| Petrol Model Rank | Vehicle Model | Manufacturer | H1 2026 Petrol Volume | Key Primary Segment |
| 1 | Maruti Suzuki Baleno | Maruti Suzuki | 64,820 Units | Premium Hatchback |
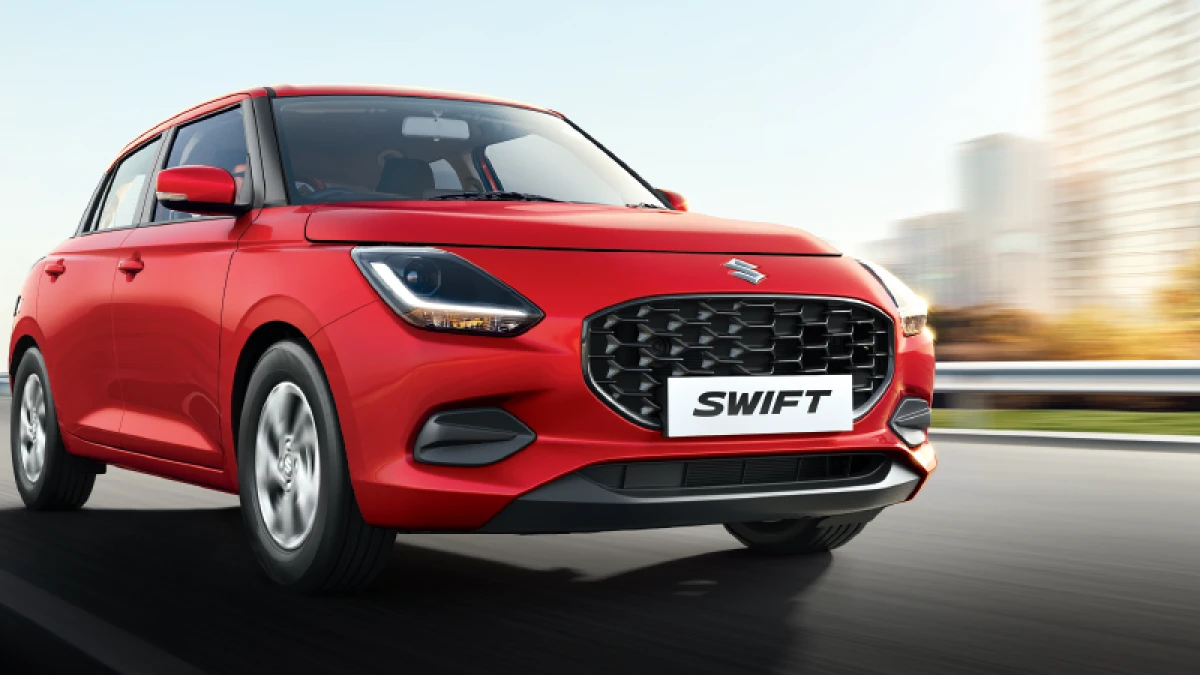
| 2 | Maruti Suzuki Swift | Maruti Suzuki | 63,150 Units | Compact Hatchback |
| 3 | Maruti Suzuki Fronx | Maruti Suzuki | 61,565 Units | Compact Crossover |
| 4 | Maruti Suzuki Alto K10 | Maruti Suzuki | 59,165 Units | Entry Hatchback |
| 5 | Hyundai Venue | Hyundai Motor | 55,750 Units | Sub-4m Compact SUV |
3. CNG Powertrain Segment: Highest Volume Growth (+40%)
Factory-fitted CNG vehicles recorded the largest absolute volume increase during H1 2026, gaining 1,69,250 units year-on-year.Driven by rising petrol prices, expanding city gas distribution networks, and the introduction of twin-cylinder boot integration and automatic transmissions (CNG-AMT), CNG market share surged to 23.0 percent, cementing its status as India’s second most popular fuel choice.
Market Dynamics & Manufacturer Shares:
- Maruti Suzuki maintained a dominant position in the CNG space, selling 4,16,203 CNG vehicles and securing a 69.8 percent segment share.
- Tata Motorssolidified its second-place ranking with 1,00,855 CNG units (16.9% share), supported by strong demand for twin-cylinder iCNG variants on the Punch and Nexon.
- Hyundai finished third with 55,024 units (9.2% share).
The table below details the top 5 bestselling factory-fitted CNG car models in India during H1 2026:
| CNG Model Rank | Vehicle Model | Manufacturer | H1 2026 CNG Volume | YoY Volume Growth (%) |
| 1 | Maruti Suzuki Dzire CNG | Maruti Suzuki | 75,339 Units | +69.0% |
| 2 | Maruti Suzuki Wagon R CNG | Maruti Suzuki | 54,267 Units | +5.0% |
| 3 | Tata Punch iCNG | Tata Motors | 41,919 Units | +43.0% |
| 4 | Tata Nexon iCNG | Tata Motors | 41,355 Units | +38.0% |
| 5 | Maruti Suzuki Ertiga CNG | Maruti Suzuki | 38,820 Units | +18.0% |
4. Diesel Powertrain Segment: Driven by Large SUVs
Despite regulatory scrutiny, tighter emissions norms, and reduced availability in small hatchbacks and sedans, diesel vehicle sales grew by 15.3 percent to 4,56,076 units in H1 2026. Diesel retained a stable 17.6 percent market share, supported almost entirely by high demand for D-segment SUVs and ladder-frame utility vehicles.
SUV Dependency & Market Leadership:
An overwhelming 94 percent of all diesel vehicles sold in India were SUVs. Mahindra & Mahindra led the diesel category, commanding a 57.2 percent market share with 2,60,880 diesel units sold. Diesel engines represented 72.8 percent of Mahindra’s total sales volume.
The table below outlines the top 5 bestselling diesel-powered passenger models in India during H1 2026:
| Diesel Model Rank | Vehicle Model | Manufacturer | H1 2026 Diesel Volume | Primary Segment / Platform |
| 1 | Mahindra Scorpio (N + Classic) | Mahindra | 86,403 Units | Body-on-Frame Mid-Size SUV |
| 2 | Mahindra Bolero (Neo + Classic) | Mahindra | 58,457 Units | Utility Vehicle / Fleet |
| 3 | Mahindra XUV700 / XEV 7XO | Mahindra | 42,190 Units | Monocoque Premium 3-Row SUV |
| 4 | Hyundai Creta Diesel | Hyundai Motor | 40,116 Units | Mid-Size Crossover SUV |
| 5 | Mahindra Thar Roxx | Mahindra | 37,945 Units | 5-Door Off-Road Lifestyle SUV |
5. Battery Electric Vehicle (BEV) Segment: Highest Percentage Surge (+65%)
The pure-electric passenger vehicle market achieved the fastest percentage growth among all fuel types in H1 2026, expanding 64.9 percent year-on-year to reach 1,39,065 units. EV market penetration rose from 3.9 percent in H1 2025 to 5.4 percent in H1 2026, driven by new model launches, expanded public fast-charging networks, and competitive pricing.
Brand Distribution & EV Reliance:
- Tata Motors maintained its leadership in the electric segment, dispatching 60,005 units and holding a 43.1 percent market share. EVs accounted for 15.8 percent of Tata’s total passenger vehicle volume.
- JSW MG Motor Indiashowed the highest dependence on electric vehicles, with BEVs contributing 77.2 percent of its total H1 dispatches.
- Mahindra expanded its EV presence to capture an 11.0 percent segment share.
The table below highlights the top 5 bestselling electric car models in India during H1 2026:
| EV Model Rank | Vehicle Model | Manufacturer | H1 2026 EV Volume | YoY Growth / Performance |
| 1 | MG Windsor EV | JSW MG Motor | 18,920 Units | Bestselling EV crossover model |
| 2 | Mahindra XEV 9S | Mahindra | 18,050 Units | Born-electric 3-row crossover |
| 3 | Tata Nexon EV | Tata Motors | 16,567 Units | +78.0% YoY growth |
| 4 | Tata Punch EV | Tata Motors | 15,683 Units | +108.0% YoY surge |
| 5 | Mahindra XEV 9e | Mahindra | 11,242 Units | Coupe-style electric SUV |
6. Strong Hybrid (HEV) Segment: Flat Performance
Strong-hybrid vehicles experienced flat sales growth during H1 2026, recording 57,885 unit dispatches compared to 57,847 units in H1 2025. Despite the addition of new models, strong-hybrid market share dipped from 2.6 percent to 2.2 percent due to GST tax structures relative to pure EVs, as well as competitive pricing on CNG and turbo-petrol models.
The table below lists the top-performing strong-hybrid models in India during H1 2026:
| Hybrid Rank | Vehicle Model | Manufacturer | H1 2026 Hybrid Volume | YoY Performance |
| 1 | Toyota Innova Hycross | Toyota Kirloskar | 27,812 Units | Dominant hybrid MPV leader |
| 2 | Toyota Urban Cruiser Hyryder | Toyota Kirloskar | 18,577 Units | +23.0% YoY growth |
| 3 | Maruti Suzuki Grand Vitara | Maruti Suzuki | 4,086 Units | -54.0% drop (shift to mild-hybrid/CNG) |
| 4 | Maruti Suzuki Victoris | Maruti Suzuki | 3,231 Units | New entry contribution |
| 5 | Maruti Suzuki Invicto | Maruti Suzuki | 1,418 Units | -26.0% YoY drop |
7. Powertrain Distribution by Vehicle Body Style
Fuel preferences varied significantly across vehicle body styles in H1 2026. While hatchbacks remained predominantly petrol-powered, sedans saw high CNG adoption, MUVs relied on a mix of CNG and petrol, and SUVs drove diesel and EV sales.
The table below illustrates how different fuel types contributed across body style categories in H1 2026:
| Body Style Category | Total H1 2026 Volume | Petrol Share (%) | CNG Share (%) | Diesel Share (%) | BEV Share (%) | Strong Hybrid Share (%) |
| SUVs (All Sizes) | 14,89,898 Units (57.5%) | 47.2% | 15.1% | 28.8% | 6.9% | 2.0% |
| Hatchbacks | 5,55,200 Units (21.4%) | 73.0% | 21.0% | 0.0% | 6.0% | 0.0% |
| Multi-Utility Vehicles (MUVs) | 3,30,840 Units (12.8%) | 40.0% | 42.0% | 8.0% | 1.0% | 9.0% |
| Sedans | 2,15,628 Units (8.3%) | 45.0% | 53.0% | 0.0% | 1.0% | 1.0% |
8. Manufacturer Powertrain Dependency Comparison
Major automakers operating in India exhibit distinct powertrain strategies. Maruti Suzuki relies heavily on petrol and CNG, Mahindra remains centered on diesel, Tata Motors maintains a balanced fuel mix, and JSW MG Motor leads in electric vehicle adoption.
The table below contrasts the fuel portfolio breakdown for India’s leading car manufacturers during H1 2026:
| Automaker Group | H1 2026 Total Volume | Petrol Dependency | CNG Dependency | Diesel Dependency | BEV Dependency | Strong Hybrid |
| Maruti Suzuki | 10,26,976 Units | 57.8% | 40.5% | 0.0% | 0.8% | 0.9% |
| Tata Motors | 3,78,909 Units | 44.7% | 26.6% | 12.9% | 15.8% | 0.0% |
| Mahindra & Mahindra | 3,58,545 Units | 16.1% | 0.0% | 72.8% | 11.1% | 0.0% |
| Hyundai Motor India | 3,05,952 Units | 63.2% | 18.0% | 17.6% | 1.2% | 0.0% |
| Toyota Kirloskar | 1,83,713 Units | 40.6% | 13.1% | 20.1% | 0.0% | 26.2% |
| JSW MG Motor India | 34,328 Units | 18.2% | 0.0% | 4.6% | 77.2% | 0.0% |
Strategic Summary & H2 2026 Market Outlook
The H1 2026 sales figures highlight a diversifying Indian passenger vehicle market. While pure petrol engines remain the overall volume leader at 51.8 percent share, CNG has established itself as a mainstream choice, accounting for nearly a quarter of all new car dispatches. At the same time, battery electric vehicles crossed the 5 percent market share threshold, led by new product launches from Tata, MG, and Mahindra.
As the industry enters the H2 2026 festive season, powertrain diversification is expected to accelerate further, driven by localized battery manufacturing, expanding charging infrastructure, and a growing range of factory-fitted CNG and electric models across various price points.
