




The Indian passenger vehicle landscape is rapidly rewriting its own rulebook, and the August 2026 electric vehicle (EV) sales data is the ultimate proof. Despite whispers of global cooling in EV demand, India’s transition to electric mobility continues to accelerate on an aggressive, upward trajectory.
According to the latest retail registration data, a robust 30,696 electric cars found their way onto Indian roads in August 2026. When compared to the relatively modest 20,210 units recorded during the exact same period last year, the market has delivered a phenomenal 51.89% year-on-year (YoY) growth rate. This equates to roughly 10,486 additional battery-electric vehicles entering the domestic ecosystem in a single month.
Yet, for those obsessing over month-to-month momentum, the data isn’t uniformly green. Total EV registrations actually slipped by 6.78% when compared to the 32,928 units sold in July 2026. Concurrently, overall EV market penetration dipped slightly from 7.90% to a still-respectable 7.63%.
But beneath these macro figures lies the truly fascinating narrative: the violent reshuffling of the competitive hierarchy. Tata Motors refuses to yield the crown, Mahindra has effectively militarized its SUV lineup to secure second place, and MG is feeling the squeeze. Most astonishingly, a relatively fresh foreign contender—Vietnam’s VinFast—has successfully outmuscled India’s undisputed automotive titan, Maruti Suzuki.
Here is the definitive, brand-by-brand breakdown of India’s electric passenger car sales for August 2026.
Electric Car Sales in India: The Big Picture Macro Trends
Before dissecting individual brand performances, we need to establish the baseline of the current market size.
| Metric | August 2026 |
| Total EV registrations | 30,696 |
| August 2025 | 20,210 |
| YoY growth | +51.89% |
| July 2026 | 32,928 |
| MoM growth | -6.78% |
| EV market penetration | 7.63% |
| EV penetration Aug 2025 | 5.83% |
The Crucial Takeaway: It is vital not to conflate a monthly sequential dip with a collapsing market. The Indian automotive retail sector frequently experiences month-over-month (MoM) volatility dictated by regional holidays, monsoon severity, and buyers strategically delaying purchases to align with impending festive season discounts. The metric that truly matters is the YoY leap—a jump of nearly 52% indicates that underlying consumer intent to adopt EVs remains incredibly healthy.
1. Tata Motors: The Undisputed Sovereign
Tata Motors remains the apex predator of the Indian EV market. Having essentially single-handedly kickstarted mass EV adoption in the country, the brand is successfully defending its territory against an onslaught of new competitors.
- August 2026 EV sales: 13,158 units
- August 2025 EV sales: 8,064 units
- YoY growth: +63.17%
- July 2026 EV sales: 13,678 units
- MoM decline: -3.80%
- Market share: 42.87%
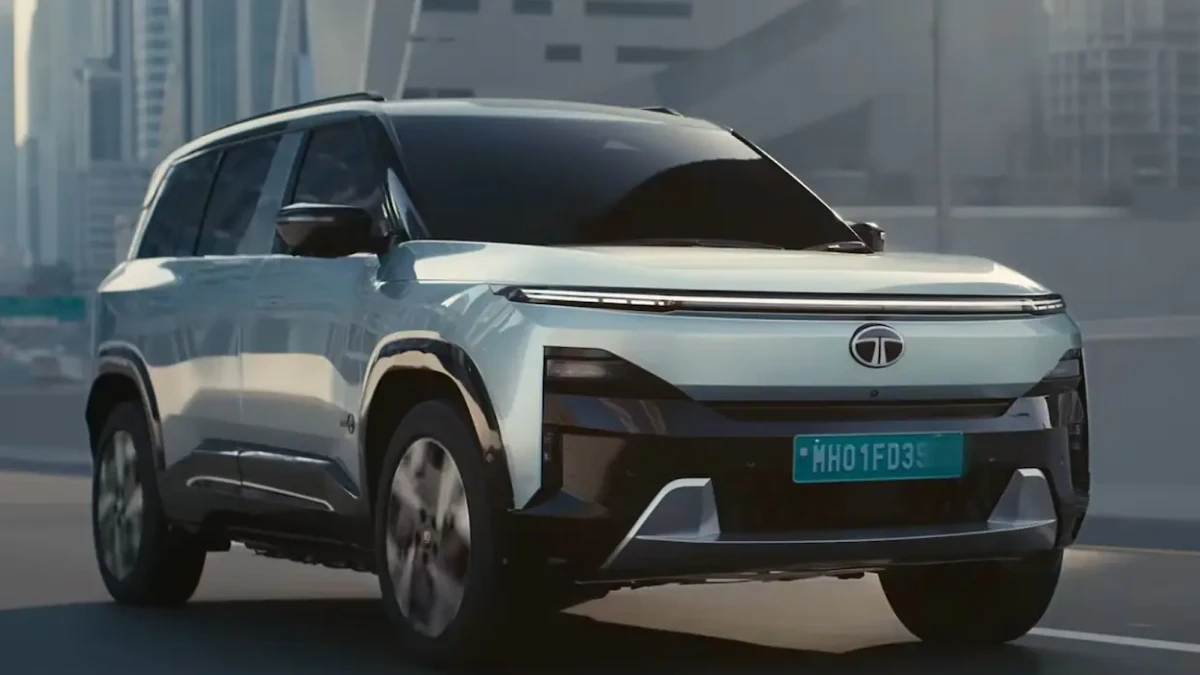
Despite a negligible 3.80% MoM dip, Tata’s year-on-year growth is nothing short of explosive. Securing nearly 43% of the total pie means that more than four out of every ten electric cars registered in India last month were built by Tata. The sheer scale of their first-mover advantage, bolstered by a heavily diversified lineup (Nexon.ev, Punch.ev, Tiago.ev, Curvv.ev), continues to pay massive dividends.
2. Mahindra: Securing the Silver Medal
Mahindra is proving that you don’t necessarily need a sprawling hatchback lineup to dominate; you just need to understand the Indian buyer’s obsession with SUVs. By aggressively pushing its Electric Origin SUV portfolio, Mahindra has firmly cemented itself as the primary threat to Tata’s hegemony.
- August 2026 EV sales: 6,464 registrations
- August 2025 EV sales: 4,139 units
- YoY growth: +56.17%
- July 2026 EV sales: 7,742 units
- MoM decline: -16.51%
- Market share: 21.06%
The data paints a stark picture of domestic dominance. When you combine Tata and Mahindra’s volumes, the two Indian legacy automakers controlled nearly 64% of all electric car registrations in the country during August.
3. JSW MG Motor: The Pressure Mounts
JSW MG Motor India successfully defended its spot on the podium, but the underlying metrics should trigger alarm bells at their corporate headquarters.
- August 2026 EV sales: 4,622 units
- August 2025 EV sales: 5,621 units
- YoY decline: -17.77%
- July 2026 EV sales: 5,689 units
- MoM decline: -18.76%
- Market share: 15.06%
MG holds the unenviable distinction of being the only manufacturer in the top three to suffer volume contractions on both a yearly and monthly basis. While they remain a critical pillar of the EV ecosystem, increasing competition in the sub-₹20 lakh bracket is clearly eating into the momentum previously enjoyed by the ZS EV, Comet EV, and Windsor EV. The upcoming rollout of the premium Hector Tomahawk EV may help pad wholesale numbers, but reversing retail momentum is the immediate challenge.
4. The Major Disruption: VinFast Surges Past Maruti
This is the headline that industry analysts will be digesting for months. Vietnam’s VinFast, a brand that was virtually non-existent in the Indian consumer consciousness just a few years ago, registered a staggering 2,199 electric cars in August.
This represents an immense 48.38% month-on-month increase.
Why this is a seismic event: VinFast is a relative newcomer playing in one of the most notoriously difficult, price-sensitive automotive markets on earth. Yet, through aggressive pricing, rapid showroom rollout, and compelling initial product offerings, they haven’t just entered the fray—they have actively overtaken India’s absolute largest automaker. VinFast is no longer an “upcoming brand”; their registration volume commands immediate respect.
5. Maruti Suzuki: Struggling to Catch Up
India’s undisputed king of the internal combustion engine (ICE) is currently looking somewhat pedestrian in the electric arena. Maruti Suzuki recorded 1,412 EV registrations, down 11.75% from July’s 1,600 units.
Securing a modest 4.60% market share, Maruti was forced to slip behind VinFast into fifth place. While Maruti is famous for taking its time before completely dominating a segment, these numbers highlight how difficult it is to play catch-up against entrenched competitors like Tata and aggressive newcomers like VinFast.
| Brand | Aug 2026 EV Sales | Market Position |
| Tata Motors | 13,158 | 1 |
| Mahindra | 6,464 | 2 |
| JSW MG Motor | 4,622 | 3 |
| VinFast | 2,199 | 4 |
| Maruti Suzuki | 1,412 | 5 |
The Chasing Pack: Hyundai, Kia, and BYD
The rest of the mainstream market is battling for single-digit market shares, though their strategies differ wildly.
- Hyundai: 803 units (+17.06% YoY, +41.87% MoM). Holding a 2.62% market share, Hyundai’s performance is currently muted. However, this is expected to change dramatically as they localize production of their high-volume electric SUVs later in the year.
- Kia: 645 units (+28.74% YoY, +37.23% MoM). Kia’s robust sequential growth is largely attributed to the initial dealership dispatches and deliveries of the newly launched, mass-market focused Kia Syros EV.
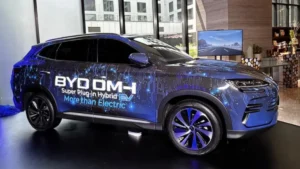
- BYD: 543 units (-6.54% YoY, -27.50% MoM). The Chinese heavyweight, which operates primarily in the premium space with the Seal, Atto 3, and eMAX 7, saw a cooling off in August, slipping in both yearly and monthly comparisons.
The Luxury EV Market: Niche but Lucrative
The premium electric segment operates under entirely different economic rules and remains highly concentrated among traditional European giants.
| Luxury Brand | August 2026 Registrations |
| BMW | 274 |
| Toyota (Premium Imports) | 161 |
| Tesla | 116 |
| Mercedes-Benz | 114 |
| Citroen | 44 |
| Volvo | 33 |
BMW continues to comfortably lead the luxury EV charge in India, proving that its diverse, ‘power of choice’ platform strategy is resonating with wealthy buyers.
Full Electric Car Sales Ranking – August 2026
For a complete overview of the market hierarchy, here are the top 14 manufacturers by retail registrations.
| Rank | Brand | EV Sales | Estimated Market Share |
| 1 | Tata Motors | 13,158 | 42.87% |
| 2 | Mahindra | 6,464 | 21.06% |
| 3 | JSW MG Motor | 4,622 | 15.06% |
| 4 | VinFast | 2,199 | ~7.16% |
| 5 | Maruti Suzuki | 1,412 | 4.60% |
| 6 | Hyundai | 803 | 2.62% |
| 7 | Kia | 645 | — |
| 8 | BYD | 543 | — |
| 9 | BMW | 274 | — |
| 10 | Toyota | 161 | — |
| 11 | Tesla | 116 | — |
| 12 | Mercedes-Benz | 114 | — |
| 13 | Citroen | 44 | — |
| 14 | Volvo | 33 | — |
(Note: Market share percentages are provided explicitly only for the leading brands as detailed in the primary registration dataset).
The Macro View: How EVs Fit Into India’s Fuel Mix
Is the EV revolution stalling? The broader data says no. Electric vehicles accounted for 7.63% of India’s total car retail sales in August 2026. While a slight drop from July, this is a massive leap forward from the 5.83% penetration rate recorded exactly one year prior (an increase of 1.80 percentage points).
Looking at the holistic powertrain mix reveals a stunning shift in consumer behavior:
| Powertrain Type | August 2026 Market Share |
| Petrol / Ethanol | 40.85% |
| CNG / LPG | 25.28% |
| Diesel | 17.21% |
| Hybrid | 9.04% |
| Electric (EV) | 7.63% |
The MotorFuturist Angle: India’s car market has definitively fractured. It is no longer a simple two-horse race between petrol and diesel. When you aggregate the sales of CNG/LPG, Hybrids, and EVs, “alternative powertrains” collectively account for 41.95% of the entire market. For the first time in history, alternative fuels are outright eclipsing pure petrol/ethanol (40.85%).
Why Did EV Sales Fall From July?
A 6.78% sequential decline naturally invites scrutiny, but context is vital. Analysts point to several contributing factors that don’t indicate long-term weakness:
- Pre-Festive Lull: Indian consumers notoriously delay big-ticket purchases in August to capitalize on massive dealer discounts offered during the September/October festive window (Navratri/Diwali).
- Inventory Calibrations: OEMs frequently adjust wholesale dispatches to clear out older inventory at dealerships before introducing new model-year features.
- Monsoon Disruptions: Heavy regional rains traditionally dampen dealership walk-ins across key EV-heavy states.
MotorFuturist Verdict
August 2026 was a fiercely revealing month for India’s electric car market. The headline is undeniably positive: despite a minor sequential dip, seeing retail EV volumes rocket by nearly 52% year-on-year to comfortably break the 30,000-unit ceiling proves that the Indian consumer’s appetite for battery-powered vehicles is structurally sound.
Tata Motors remains the gravitational center of the industry, operating on a volume scale that its rivals simply cannot match. Mahindra has brilliantly leveraged its SUV DNA to establish an impregnable second-place stronghold.
But the truest indicator of how fast this market is moving is VinFast. By blitzing past Maruti Suzuki to claim fourth place, the Vietnamese automaker has proven that legacy brand equity offers zero protection in the EV era.
The initial phase of India’s EV transition—convincing people that electric cars are viable—is officially over. The next phase will be a bloody, margin-crushing dogfight to see which manufacturers can survive as the market is flooded with affordable, feature-heavy, locally produced alternatives.
FAQ
How many electric cars were sold in India in August 2026?
According to retail registration data, exactly 30,696 electric passenger cars were registered in India during August 2026.
Which company sold the most electric cars in August 2026?
Tata Motors led the market by a massive margin, registering 13,158 units and securing a 42.87% market share.
Which is the second-largest EV brand in India?
Mahindra firmly holds the second position, registering 6,464 EVs in August and capturing a 21.06% market share.
Did VinFast beat Maruti in EV sales?
Yes. In a major industry shakeup, VinFast registered 2,199 electric cars compared to Maruti Suzuki’s 1,412 units, placing VinFast fourth and Maruti fifth for the month.
What was India’s EV market share in August 2026?
Battery electric vehicles accounted for 7.63% of total passenger car retail sales in August 2026.
Did overall EV sales grow in August 2026?
Yes. Overall EV registrations increased by an impressive 51.89% year-on-year, despite experiencing a minor 6.78% month-on-month decline compared to the preceding month of July 2026.

