



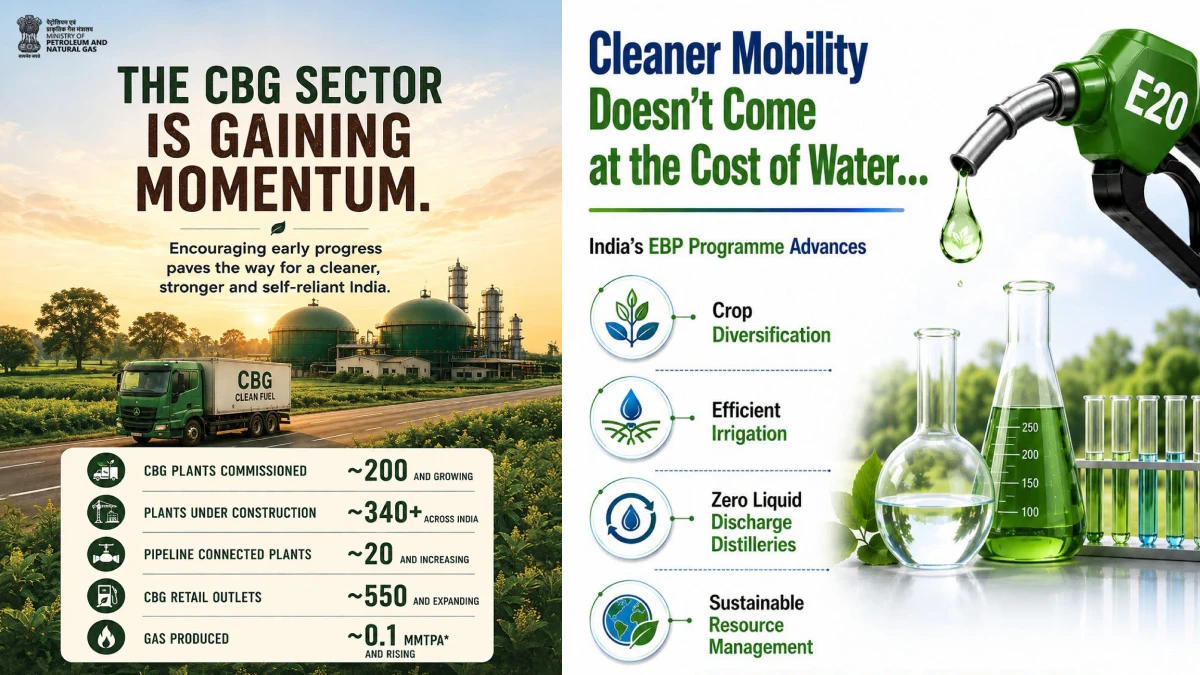
Following the successful nationwide rollout of E20 ethanol-blended petrol (20% ethanol blend), the Ministry of Petroleum and Natural Gas (MoPNG) and the Ministry of New and Renewable Energy (MNRE) have shifted their strategic focus toward Compressed Bio-Gas (CBG) / Bio-CNG.Driven by the GOBARdhan (Galvanizing Organic Bio-Agro Resources Dhan) scheme and the National Bioenergy Programme, India is institutionalizing a mandatory CBG Blending Obligation (CBO) across the transport and domestic piped natural gas sectors.
With natural gas imports accounting for nearly 50% of domestic consumption, replacing imported Liquefied Natural Gas (LNG) with domestically refined biomethane processed from agricultural waste, sugar mill press mud, municipal solid waste (MSW), and cattle dung strengthens national energy security while tackling stubble burning.
1. Mandatory CBG Blending Trajectory (CBO Roadmap)
To guarantee off-take security for private project developers and financial institutions, the National Biofuels Coordination Committee (NBCC) approved a phase-wise mandatory blending roadmap for City Gas Distribution (CGD) entities operating in CNG (transport) and PNG (domestic) networks.
The table below outlines the legally binding Compressed Bio-Gas Blending Obligation (CBO) roadmap and projected national volume demand:
| Financial Year (FY) | CBO Mandate (%) | Status / Compliance Phase | Projected CBG Offtake Volume | National Economic & Import Impact |
| FY 2024–25 | Voluntary | Phase-in & Infrastructure Setup | ~0.35 MMSCMD | Pilot off-take trials across OMCs and CGDs |
| FY 2025–26 | 1.0% | Mandatory Compliance Begins | ~1.65 MMSCMD | Replaces ~0.60 Million Metric Tonnes (MMT) imported LNG |
| FY 2026–27 | 3.0% | Expanded CGD Network Integration | ~4.95 MMSCMD | Cuts LNG import bills by ~$1.2 Billion annually |
| FY 2027–28 | 4.0% | Industrial Heating Integration | ~6.60 MMSCMD | Diverts 12+ Million Tonnes of agricultural stubble |
| FY 2028–29 Onwards | 5.0% | Full Commercial Scale Target | ~8.25 MMSCMD | Target of 750+ operational commercial CBG plants |
*MMSCMD = Million Standard Cubic Meters Per Day. Projected demand calculated on India’s CGD natural gas consumption baseline.
2. Policy Framework, Incentives, and Pricing Structure
The government has introduced key policy reforms to transform CBG project economics from voluntary pilot models into commercial-grade infrastructure assets.The Union Cabinet approved the National Circular Bioenergy Scheme under GOBARdhan with an outlay of ₹23,731 crore (FY 2026–27 to FY 2035–36), establishing stable floor pricing, capital subsidies, and pipeline connectivity support.
The table below summarizes the core fiscal incentives, pricing mechanisms, and central support frameworks for Bio-CNG projects:
| Policy Instrument / Benefit Head | Statutory Value / Rate | Governing Scheme / Ministry | Primary Operational Objective |
| CBG Offtake Base Price | ₹1,478 per MMBTU (~₹77.4/kg) | MoPNG Administered Pricing | Fixed remunerative price tied to 85% of retail CNG |
| Excise Duty Exemption | 100% Exemption on CBG Component | Ministry of Finance (Union Budget) | Removes double taxation on CBG portion of blended CNG |
| Capital Grant Support | Up to ₹2 Crore per Ton/Day Capacity | GOBARdhan / MoPNG Framework | Reduces upfront EPC expenditure for greenfield plants |
| Fermented Organic Manure (FOM) | ₹1,500 per MT Market Support (MDA) | Department of Fertilizers | Monetizes organic bio-fertilizer by-product |
| Pipeline Connectivity Assistance | DPI Scheme Infrastructure Subsidy | Ministry of Petroleum & Natural Gas | Connects distant CBG plants to trunk gas pipelines |
3. Feedstock Yield Comparison & Conversion Metrics
Bio-CNG plants utilize anaerobic digestion (bacterial breakdown of organic waste in oxygen-free environments) to produce biogas containing 55–65% methane ($CH_4$), which is purified to over 90–95% pure biomethane (IS 16087:2025 standard) to match fossil CNG. Yield efficiency varies significantly based on feedstock dry-matter content and carbon-to-nitrogen (C:N) ratios.
The table below contrasts various organic feedstock categories used in Indian CBG plants:
| Feedstock Material Source | Methane Yield per Tonne | Average Plant Processing Ratio | Secondary By-Product Yield | Environmental Co-Benefit |
| Sugarcane Press Mud | 65 kg – 85 kg CBG / Tonne | 120 Tonnes/Day for 10 TPD Plant | High-grade liquid organic digestate | Eliminates sugar mill sludge disposal hazards |
| Paddy Straw / Agricultural Stubble | 45 kg – 60 kg CBG / Tonne | 180 Tonnes/Day for 10 TPD Plant | Solid Fermented Organic Manure (FOM) | Prevents Northern India seasonal air pollution |
| Cattle Dung (Gobar) | 18 kg – 25 kg CBG / Tonne | 450 Tonnes/Day for 10 TPD Plant | Liquid slurry for direct soil injection | Supplemental steady cash income for dairy farmers |
| Municipal Solid Waste (Segregated) | 35 kg – 50 kg CBG / Tonne | 220 Tonnes/Day for 10 TPD Plant | Inert compost & refuse-derived fuel | Diverts urban waste from landfill sites |
| Poultry Litter / Food Waste | 70 kg – 90 kg CBG / Tonne | 110 Tonnes/Day for 10 TPD Plant | Nitrogen-rich bio-fertilizer | High-energy yield per unit volume processed |
4. State-Wise Infrastructure Rollout & Plant Pipeline
As of mid-2026, 210 commercial CBG plants are operational across India, with over 320 additional facilities currently under construction. Agricultural states with high crop-residue volumes and sugar manufacturing hubs lead the infrastructure rollout.
The table below highlights the state-wise distribution of commissioned and under-construction CBG plants under the GOBARdhan portal:
| Indian State / Union Territory | Commissioned CBG Plants | Under-Construction Plants | Primary Local Feedstock Utilized | Key State Support Policies |
| Uttar Pradesh | 48 Plants | 80 Plants | Sugarcane Press Mud & Stubble | UP Bioenergy Policy (Capital Subsidy up to ₹20 Cr) |
| Punjab & Haryana | 32 Plants | 42 Plants | Paddy Straw (Paddy Stubble) | Special Aggregation Machinery Subsidies (BAM) |
| Maharashtra | 28 Plants | 46 Plants | Sugarcane Press Mud & MSW | Single-Window PESO & Pollution Board Approvals |
| Gujarat | 22 Plants | 35 Plants | Cattle Dung & Industrial Organic Waste | GSDMA Land Lease Concessions for Bio-Energy |
| Karnataka & Tamil Nadu | 26 Plants | 38 Plants | Press Mud, Poultry Waste & Food Waste | State Electricity Board Tariff Concessions |
| Rest of India | 54 Plants | 83 Plants | Municipal Solid Waste & Distillers Grain | SBM-U 2.0 Viability Gap Funding Support |
5. Economic & Environmental Impact: Bio-CNG vs. Fossil Natural Gas (LNG/CNG)
Replacing imported fossil natural gas with domestically refined Bio-CNG offers direct advantages across trade balance, carbon intensity, and rural economic development.
The table below contrasts the financial, operational, and lifecycle carbon metrics of Bio-CNG against fossil-derived Compressed Natural Gas (CNG) and Liquefied Natural Gas (LNG):
| Comparative Parameter | Bio-CNG (Compressed Bio-Gas) | Fossil CNG (Imported LNG Derived) |
| Source / Production Origin | Domestic organic waste & biomass (100% Renewable) | Fossil gas wells / Imported cryogenic LNG ships |
| Calorific Value (Energy Density) | 52,000 kJ/kg (Pure Methane equivalent) | 52,000 kJ/kg (Equivalent combustion output) |
| Foreign Exchange Outflow | ₹0 / kg (100% Import Substitution) | ~$11.00 – $14.00 per MMBTU foreign exchange outflow |
| Lifecycle Carbon Intensity | Net-Zero / Carbon-Negative (Captures $CH_4$) | Positive Net Emissions (+2.75 kg $CO_2$e per kg consumed) |
| Vehicle Engine Compatibility | 100% Seamless Swap (No Retuning Needed) | Standard Factory CNG Vehicle Tuning Required |
| Rural Job Creation Factor | High (Biomass aggregation, supply chain logistics) | Low (Centralized import terminal operations) |
Strategic Outlook: Building India’s Circular Bio-Economy
The mandatory Compressed Bio-Gas Blending Obligation (CBO) marks a structural shift in India’s clean mobility strategy. By enforcing a 3% blend in FY 2026–27 scaling to 5% by FY 2028–29, the GOBARdhan initiative guarantees demand for project developers, reduces municipal waste management burdens, cuts stubble burning, and lowers India’s fossil energy import bill.
Combined with the nationwide availability of E20 petrol and expanding electric vehicle adoption, Bio-CNG forms a crucial third pillar in India’s transition toward sustainable transportation and net-zero carbon emissions by 2070.

